A data analytics app used by 900+ marketing campaign managers worldwide
Turning stakeholder feedback into better experience for campaign managers.
This case study was completed under NDA. Identifying details have been anonymized; performance metrics shown are accurate.
Context
Marketing teams were spending more time hunting for insights than acting on them. Campaign analytics scattered across multiple platforms meant hours of manual data compilation, leaving little time for strategy. Without consolidated, actionable information, decision-making was slow and based on incomplete pictures, frustrating users and limiting their impact.
Product setup
- 1 Lead Designer
- 1 Mid UX/UI Designer (me)
- 1 UX Designer
- 3 front-end developers
- 6 back-end developers
- 2 stakeholders
Key elements
This product had multiple particularities in its complex interface.
The dashboard
The interface centers around a campaign overview dashboard that gives marketers immediate visibility into what matters most. Real-time performance metrics sit front and center, supported by visual trend indicators that make patterns instantly recognizable. Quick action buttons for common tasks mean users can act on insights without hunting through menus.
Complex data
For deeper analysis, interactive charts and graphs let users explore their data from multiple angles, while customizable reporting views adapt to different stakeholder needs. Export functionality ensures insights can easily move from analysis to presentation.
Notification center
To help teams stay proactive, a prominent notification center keeps critical updates visible, while contextual optimization suggestions guide users toward better performance. Priority-based categorization ensures the most important alerts rise to the top.
Budget planning
The budget management interface brings financial planning and performance together in one view. Visual budget allocation tools make it easy to see where money is going, forecasting capabilities help teams plan ahead, and ROI tracking displays connect spending directly to results.
Gamification
This was a key stakeholder requirement that shaped the experience. We integrated game-like elements into select features to keep campaign managers engaged and motivated, turning routine optimization into an experience that feels rewarding and encourages consistent platform use.
When stakeholder vision meets user reality
Stakeholders were clear: the KPI Generator needed an interface based on their internal “molecule” diagram, a structure campaign managers already knew from PDF reports. The vision was ambitious: an interactive, gamified experience where users would drag, hover and click through hexagonal elements to explore data and generate key results.
I designed a three-step flow: select an objective based on their molecule framework, adjust dimensions like budget and timeline, then let the tool calculate and display results. I built a fully functional high-fidelity prototype with guided onboarding and conducted multiple rounds of user testing.
The results were clear: while users recognized the molecule structure, the gamified interaction proved too complex. Frustration emerged where engagement was intended.
Convincing stakeholders to pivot was not easy, but armed with user feedback, we proposed a leaner, more straightforward generator. By reducing complexity at the exact confusion points we had identified, we created an experience that honored their familiar framework while actually working for users.
The solution: a “periodic table of KPIs”
We redesigned the generator around flexibility and clarity, what stakeholders called the “periodic table of KPIs”. Users now had two clear paths to generate results: build a custom selection of molecules based on their specific needs, or choose from predefined molecule sets aligned with common campaign goals.
From there, users could refine their selection by setting a communications goal and adjusting key dimensions, ensuring benchmarks were accurate and relevant to their context.
The final step displayed KPI details in a clean data table, where users could explore specific insights and share campaigns via shareable links. The molecule framework remained, but the interaction became straightforward, honoring stakeholder vision while actually serving user needs.
Impact and lessons learned
I left the project before the final stakeholder decision was made, so I cannot speak to which solution ultimately shipped. However, this experience shaped how I approach design problems today.
This was my first time designing for complex data dashboards and navigating high-stakes stakeholder dynamics. I learned how to advocate for users with research, build prototypes that moved conversations forward, and balance competing priorities between business goals and usability.
As a mid designer then, I was learning to find my voice in these conversations. Today, I would approach several aspects differently, particularly accessibility considerations and some UX decisions in supporting flows.
That perspective is valuable: it reminds me that growth comes from honestly assessing what worked, what did not, and what I would do better next time.
Other projects
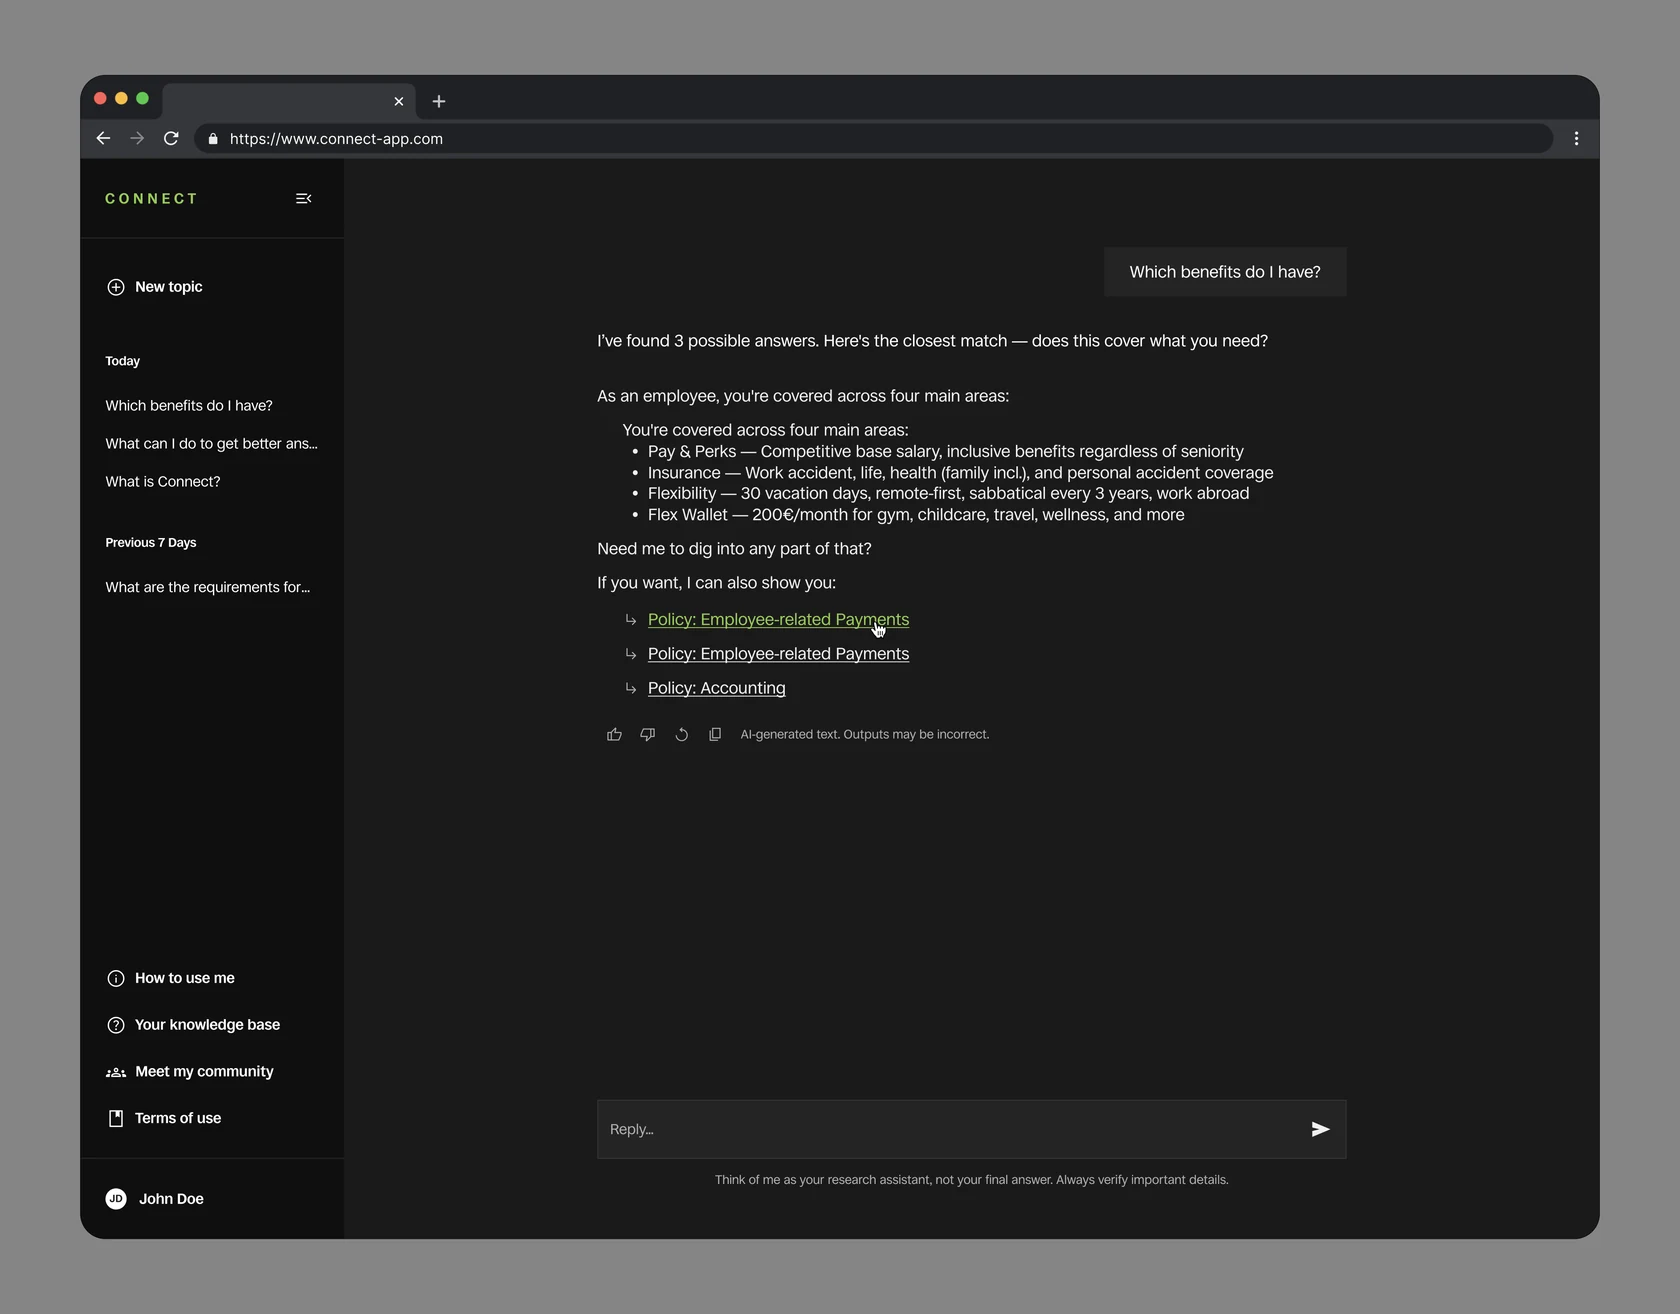
An internal AI assistant employees had stopped trusting
Turning a mandatory category picker into a system that answers with confidence.
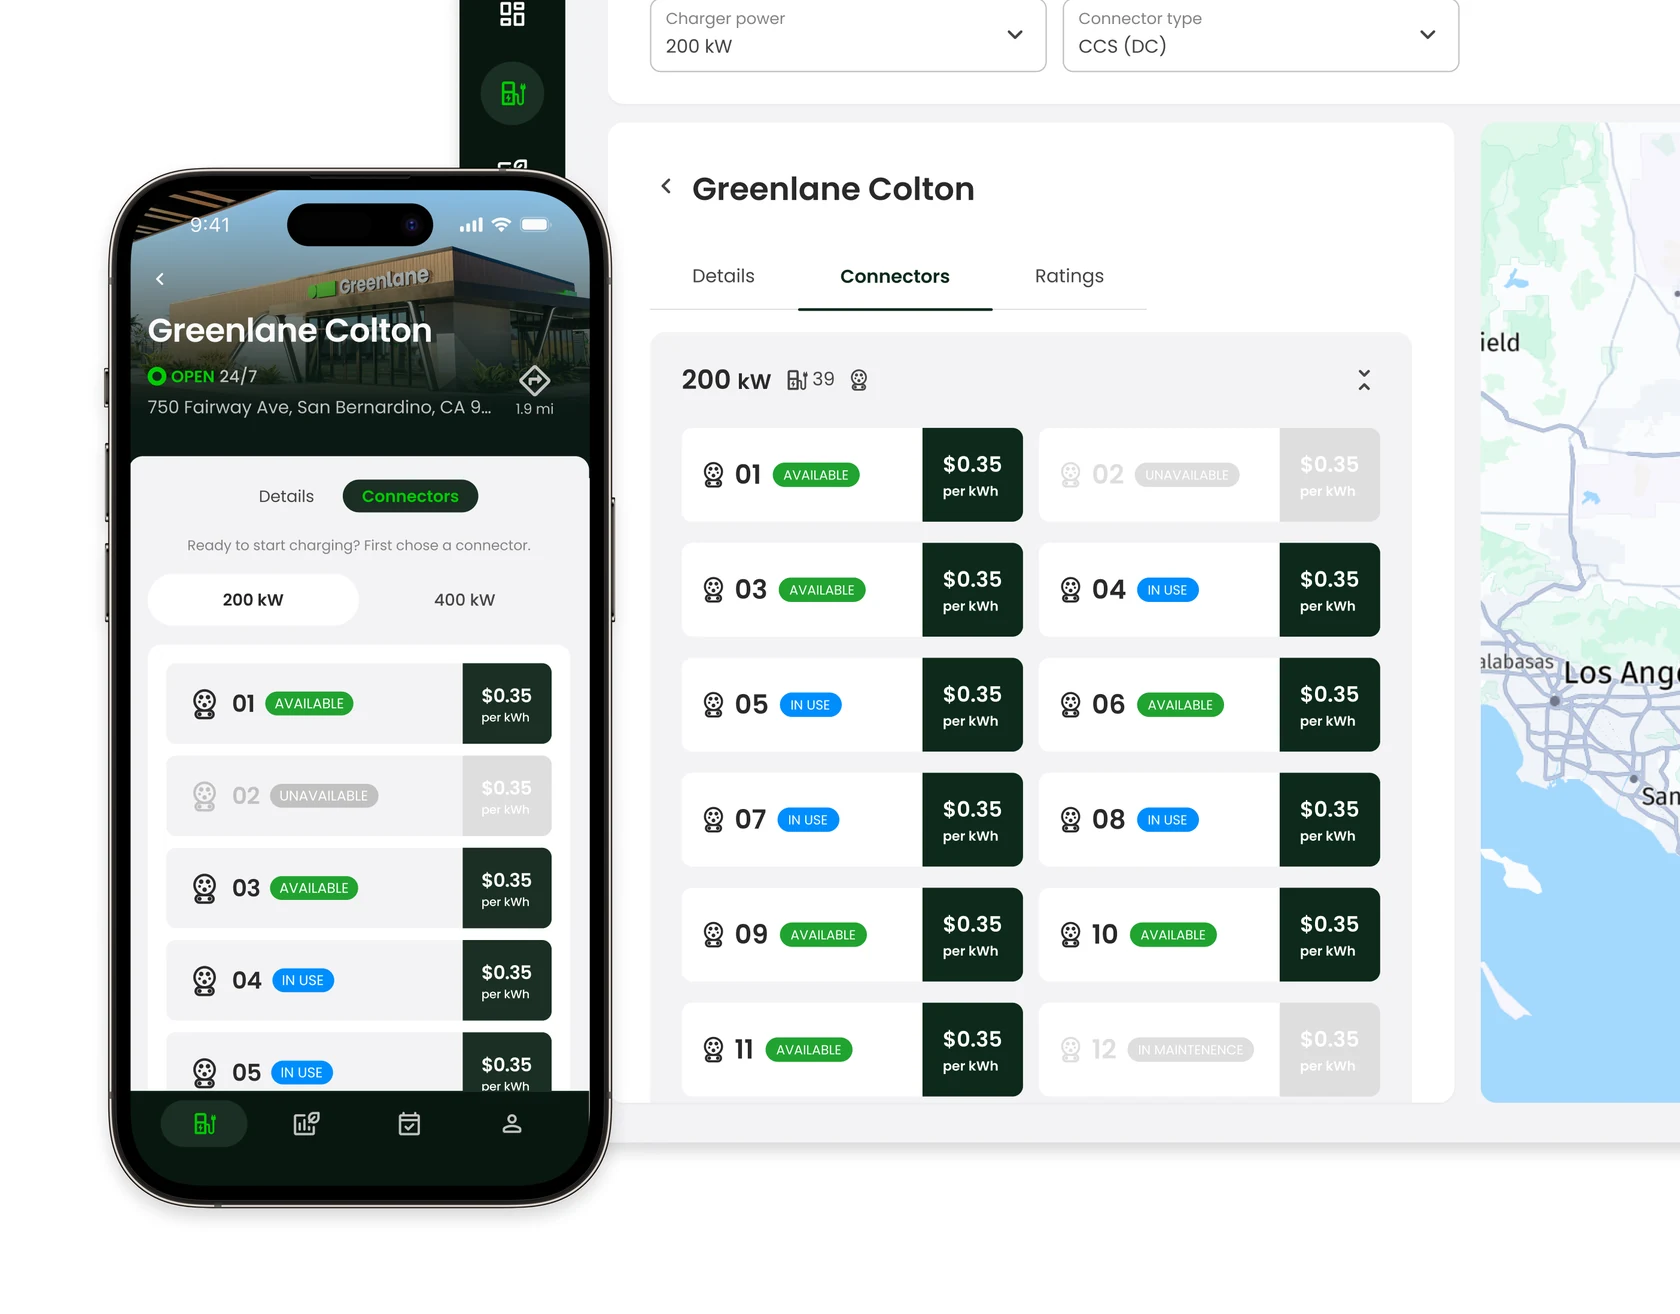
Two EV platforms launched on time with all key features intact in 10 months
Designing the technology foundation for electrifying commercial transportation of goods for two different users: fleet managers and truck drivers.